Beacon Aggregations
WiP
Beacon aggregations are currently work in progress and may change without deprecation. They are not part of the official version 2.n specification and should not be implemented in production environments yet. Use with caution for testing, follow related PRs and provide feedback!
Overview and Use Cases
While the Beacon API provides different ways to discover and potentially retrieve
data in biomedical genomics resources, with version 2.n responses were limited to
global content (boolean or overall count of matched data and static collection information)
or full record level access which for most resources would not be possible in a
public context. Responses under the new aggregated granularity level allow to:
- provide granular data overwiews about the content of resources and their collections, e.g. numbers of samples with individual features or combinations of features
- profile query responses for multiple (single or intersected) parameters
Development Requirements and Design Principles
- aggregations should be based on the same model as the rest of the Beacon API, so that they can be
applied to any data endpoint and any resourcs
- aggregating property values at the level of beacons, collections and records
- multi-dimensional, i.e. intersecting aggregations should be possible, so that the counts for combinations of features can be reported
- the principle reported values should be counts while other statistical measures (range, mean, median, etc.) could be added in the future
- aggregations should provide a means to report on binned values, e.g. for numeric values such as age or other continuous variables
- aggregations should be able to report on pre-defined sets of values, e.g. for a set of disease codes, genes or other entities
Endpoints
/aggregation_terms
Similar to the /filtering_terms endpoint, this endpoint returns the list of
individual aggregation terms that can be used to construct the aggregators parameters.
Examples for /aggregation_terms
This example beacon provides aggregation terms at the /aggregation_terms entry type inside response.aggregationTerms; for space reasons they are split
into different views here.
{
  "id": "HistologicalDiagnoses",
  "label": "Histological Diagnoses",
  "modelProperty": "biosample.histologicalDiagnosis.id"
}
Here the values for the histologicalDiagnosis property are only evaluated
for a few selected entities.
{
  "id": "SelectedCarcinomaDiagnoses",
  "label": "Selected Carcinoma Diagnoses",
  "modelProperty": "biosample.histologicalDiagnosis.id",
  "categories": [
    {"value": "NCIT:C2919", "name": "Prostate Adenocarcinoma"},
    {"value": "NCIT:C4017", "name": "Breast Ductal Carcinoma"},
    {"value": "NCIT:C3512", "name": "Lung Adenocarcinoma"}
  ]
}
{
  "id": "SexAtBirth",
  "modelProperty": "individual.sex.id",
  "categories": [
    {"value": "NCIT:C16576", "name": "female"},
    {"value": "NCIT:C20197", "name": "male"},
    {"value": "NCIT:C1799", "name": "unknown"}
  ]
}
This aggregation does not indicate a specific property in the model but provides the available categories.
{
  "description": "Aggregation by the age of onset of the individuals with pre-defined age ranges.",
  "id": "AgeOfOnset",
  "label": "Age of Onset",
  "modelProperty": "individual.diseases.ageofOnset",
  "categories": [
      {
          "name": "birth to 18 months",
          "rangeBounds": ["P0D", "P18M"],
          "sortOrder": 1
      },
      {
          "name": "1.5 to 10 years",
          "rangeBounds": ["P18M", "P10Y"],
          "sortOrder": 2
      },
      {
          "name": "10 to 60 years",
          "rangeBounds": ["P10Y", "P60Y"],
          "sortOrder": 3
      },
      {
          "name": "60 years and older",
          "rangeBounds": ["P60Y"],
          "sortOrder": 4
      }
  ]
}
Other endpoints
Standard data endpoints can provide aggregation results, if the aggregated
granularity is specified in the request.
Requests
Parameters
requestedGranularityaggregators: list of aggregation objects to be applied to the query. The aggregation objects (i.e.aggregators) are constructed from one or more aggregation terms which should be indicate in the/aggregation_termsendpoint.
Responses
The format of the response will be a
beaconAggregationReponse, i.e. an extension of a beaconCountResponse with
an additional section responseAggregation containing the aggregation results.
For beaconResultsetResponses (e.g. upon a query at a data endpoints such as
/biosamples), per resultset resultsAggregation should be provided instead of
the results section.
Examples
Request
The example request uses the ontology filter NCIT:C3512 to match individuals
with lung adenocarcinomas and requests data aggregations. No aggregators
are specified in the request; i.e. the beacon decides.
{
  "requestedGranularity": "aggregated",
  "filters": [
    {"id": "NCIT:C3512"}
  ],
  "aggregators": [
    {
      "requestId": "aggr1",
      "aggregationTerms": [
        {"id": "SexAtBirth", "label" "Sex at Birth"}
      ]
    }
  ]
}
Response
Here the beacon provides (only) an aggregation of the sex of the matched individuals.
"resultsAggregation": [
  {
      "requestId": "aggr1",
      "aggregationTerms": [
          {"id": "SexAtBirth"}
      ],
      "categoriesAndValues": [
          {
              "count": 778,
              "categories": [
                {"value": "NCIT:C16576", "name": "female"}
              ]
          },
          {
              "count": 957,
              "categories": [
                {"value": "NCIT:C20197", "name": "male"}
              ]
          },
          {
              "count": 11,
              "categories": [
                {"value": "NCIT:C1799", "name": "unknown"}
              ]
          }
      ]
  }
]
Request
Note: In principle the categories parameter would not be needed here
if the beacon indicates that those categories are part of a predefined
SelectedCarcinomaDiagnoses aggregationTerm.
"aggregators": [
  {
    "requestId": "aggr2",
    "aggregationTerms": [
      {
        "id": "SelectedCarcinomaDiagnoses",
        "label": "Selected diagnoses (some carcinoma entities)",
        "categories": [
          {
            "name": "Prostate Adenocarcinoma",
            "value": "NCIT:C2919"
          },
          {
            "name": "Breast Ductal Carcinoma",
            "value": "NCIT:C4017"
          },
          {
            "name": "Lung Adenocarcinoma",
            "value": "NCIT:C3512"
          }
        ]
      }
]}]
Only the aggregators parameter is shown (which could be combined w/ any
filters and/or variant parameters request, depending on the beacon).
Response
Here the beacon provides (only) an aggregation of the selected diagnoses of the matched individuals.
"resultsAggregation": [
  {
    "requestId": "aggr2",
    "aggregationTerms": [
      {
        "id": "SelectedCarcinomaDiagnoses",
        "label": "Selected diagnoses (some carcinoma entities)"
      }
    ],
    "categoriesAndValues": [
      {
        "count": 426,
        "categories": [
          {
            "value": "NCIT:C2919",
            "name": "Prostate Adenocarcinoma"
          }
        ]
      },
      {
        "count": 523,
        "categories": [
          {
            "value": "NCIT:C4017",
            "name": "Breast Ductal Carcinoma"
          }
        ]
      },
      {
        "count": 317,
        "categories": [
          {
            "value": "NCIT:C3512",
            "name": "Lung Adenocarcinoma"
          }
        ]
      }
    ],
  }
]
Request
Here the intersecting counts for 2 properties are reported. Note that for
SexAtBirth only known values are used; i.e. the unknown (or other...)
category is not included in the aggregations.
As above, the categories parameter would not be needed for the SelectedCarcinomaDiagnoses
if the same values are part of its definition.
"aggregators": [
  {
    "requestId": "aggr3",
    "aggregationTerms": [
      {
        "id": "SexAtBirth",
        "categories": [
          {"value": "NCIT:C16576", "name": "female"},
          {"value": "NCIT:C20197", "name": "male"}
        ]
      },
      {
        "id": "SelectedCarcinomaDiagnoses",
        "categories": [
          {"value": "NCIT:C2919", "name": "Prostate Adenocarcinoma"},
          {"value": "NCIT:C4017", "name": "Breast Ductal Carcinoma"},
          {"value": "NCIT:C3512", "name": "Lung Adenocarcinoma"}
        ]
      }
    ]
  }
]
Only the aggregators parameter is shown (which could be combined w/ any
filters and/or variant parameters request, depending on the beacon).
Response
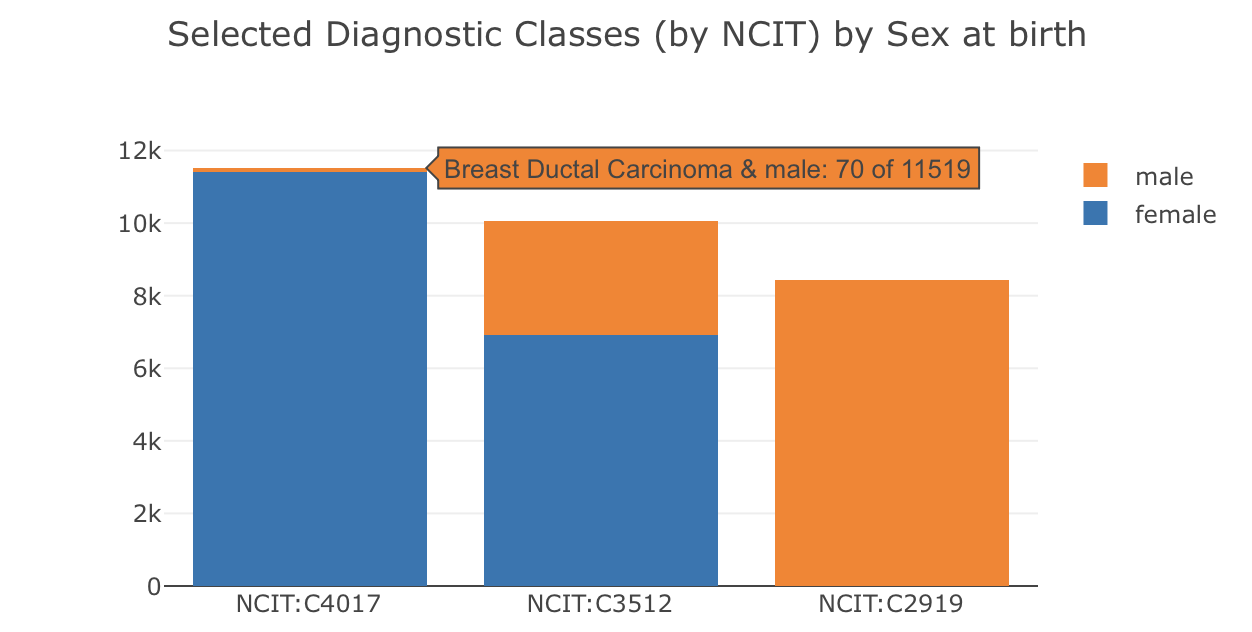
Aggregation of the different combinations for selected values representing sex at birth and histological diagnosis are returned.
![]()
The stacked bar chart was generated in Plotly.js from the Beacon 2D aggregation in the example below, directly derived from the response JSON on the Progenetix site and reflecting the resource's content. The list of aggregationTerms is essential for understanding the order of
the dimensions in the ids and names in the categoriesAndValues list -
think of them as [x, y] axes and [x, y] values in a plot (though the
order can obviousluy be transposed). The example plot does not necessarily reflect
the example data.
"resultsAggregation": [
  {
    "requestId": "aggr3",
    "aggregationTerms": [
      {"id": "SexAtBirth", "label": "Sex at Birth"},
      {"id": "HistologicalDiagnoses", "label": "Selected Diagnoses"}
    ],
    "categoriesAndValues": [
      {
        "count": 426,
        "categories": [
          {"value": "NCIT:C2919", "name": "Prostate Adenocarcinoma"},
          {"value": "NCIT:C20197", "name": "male"}
        ]
    },
      {
        "count": 0,
        "categories": [
          {"value": "NCIT:C2919", "name": "Prostate Adenocarcinoma"},
          {"value": "NCIT:C16576", "name": "female"},
        ]
    },
      {
        "count": 4,
        "categories": [
          {"value": "NCIT:C4017", "name": "Breast Ductal Carcinoma"},
          {"value": "NCIT:C20197", "name": "male"}
        ]
      },
      {
        "count": 501,
        "categories": [
          {"value": "NCIT:C4017", "name": "Breast Ductal Carcinoma"},
          {"value": "NCIT:C16576", "name": "female"}
        ]
      },
      {
        "count": 201,
        "categories": [
          {"value": "NCIT:C3512", "name": "Lung Adenocarcinoma"},
          {"value": "NCIT:C20197", "name": "male"}
        ]
      },
      {
        "count": 66,
        "categories": [
          {"value": "NCIT:C3512", "name": "Lung Adenocarcinoma"},
          {"value": "NCIT:C16576", "name": "female"}
        ]
      }
    ]
  }
]
Request
Note: In principle the categories parameter would not be needed here
if the beacon indicates that those range categories are part of a predefined
AgeOfOnset aggregationTerm.
"aggregators": [
  {
    "requestId": "aggr4",
    "aggregationTerms": [
      {
        "id": "AgeOfOnset",
        "categories": [
          {
            "name": "birth to 18 months",
            "rangeBounds": ["P0D", "P18M"],
            "sortOrder": 1
          },
          {
            "name": "1.5 to 10 years",
            "rangeBounds": ["P18M", "P10Y"],
            "sortOrder": 2
          },
          {
            "name": "10 to 60 years",
            "rangeBounds": ["P10Y", "P60Y"],
            "sortOrder": 3
          },
          {
            "name": "60 years and older",
            "rangeBounds": ["P60Y"],
            "sortOrder": 4
          }
        ]
      }
    ]
  }
]
Only the aggregators parameter is shown (which could be combined w/ any
filters and/or variant parameters request, depending on the beacon).
Response
Here the beacon provides (only) an aggregation of the sex of the matched individuals.
"resultsAggregation": [
  {
    "requestId": "aggr4",
    "aggregationTerms": [
      {
        "description": "Age of onset of the disease addressed in the data. The aggregation of age values has been peformed on splits for the indicated age ranges. The number of individuals with unknown or older age of onset is included as a separate category.",
        "id": "AgeOfOnset",
        "sorted": true
      }
    ],
    "categoriesAndValues": [
      {
        "count": 426,
        "categories": [
          {
            "value": "[P0D, P18M)",
            "name": "birth to 18 months",
            "sortOrder": 1
          }
        ]
      },
      {
        "count": 339,
        "categories":[
          {
            "value": "[P18M, P10Y)",
            "name": "1.5 to 10 years",
            "sortOrder": 2
          }
        ]
      },
      {
        "count": 61,
        "categories": [
          {
            "value": "[P10Y, P60Y)",
            "name": "10 to 60 years",
            "sortOrder": 3
          }
        ]
      },
      {
        "count": 719,
        "categories": [
          {
            "value": "other",
            "name": "older or unknown",
            "sortOrder": 4
          }
        ]
      }
    ]
  }
]
Request
This requests aggregates sets of genes and the types of variants they're affected
by with. The CancerPanelGeneIds aggregation term is defined in the /aggregation_terms endpoint and provides a list of genes that are part of a cancer panel. The VariantVRSCNVtype aggregation term is also defined in the /aggregation_terms endpoint and provides a list of variant types (e.g., high-level loss, high-level gain) that are associated with the genes in the cancer panel.
As above, the categories modifiers would not be needed if already indicated
in the respective aggregation term definitions.
"aggregators" : [
  {
    "requestId": "aggr5",
    "aggregationTerms": [
      {
        "id": "CancerPanelGeneIds",
        "label": "Cancer Panel Genes",
        "categories": [
          {"value": "CDKN2A", "name": "CDKN2A"},
          {"value": "TP53", "name": "TP53"},
          {"value": "EGFR", "name": "EGFR"},
          {"value": "MYCN", "name": "MYCN"}
        ]
      },
      {
        "id": "VariantVRSCNVtype",
        "label": "High-level Copy Number Variants",
        "categories": [
          {"value": "EFO:0020073", "name": "high-level loss"},
          {"value": "EFO:0030072", "name": "high-level gain"}
        ]
      }
    ]
  }
]
Response
This aggregation response is a two-dimensional aggregation of the counts of samples with specific gene variants (high-level loss or gain) for a set of cancer panel genes. The categoriesAndValues section provides the counts for each combination of gene and variant type.
This represents a typical application for generating a "gene panel dashboard".
"resultsAggregation": [
  {
    "requestId": "aggr5",
    "aggregationTerms": [
      {"id": "CancerPanelGeneIds", "label": "Cancer Panel Genes"},
      {"id": "VariantVRSCNVtype", "label": "High-level Copy Number Variants"}
    ],
    "categoriesAndValues": [
      {
        "count": 277,
        "categories": [
          {"value": "CDKN2A", "name": "CDKN2A"},
          {"value": "EFO:0020073", "name": "high-level loss"}
        ]
      },
      {
        "count": 0,
        "categories": [
          {"value": "CDKN2A", "name": "CDKN2A"},
          {"value": "EFO:0030072", "name": "high-level gain"}
        ]
      },
      {
        "count": 68,
        "categories": [
          {"value": "TP53", "name": "TP53"},
          {"value": "EFO:0020073", "name": "high-level loss"}
        ]
      },
      {
        "count": 4,
        "categories": [
          {"value": "TP53", "name": "TP53"},
          {"value": "EFO:0030072", "name": "high-level gain"}
        ]
      },
      {
        "count": 0,
        "categories": [
          {"value": "EGFR", "name": "EGFR"},
          {"value": "EFO:0020073", "name": "high-level loss"}
        ]
      },
      {
        "count": 161,
        "categories": [
          {"value": "EGFR", "name": "EGFR"},
          {"value": "EFO:0030072", "name": "high-level gain"}
        ]
      },
      {
        "count": 2,
        "categories": [
          {"value": "MYCN", "name": "MYCN"},
          {"value": "EFO:0020073", "name": "high-level loss"}
        ]
      },
      {
        "count": 88,
        "categories": [
          {"value": "MYCN", "name": "MYCN"},
          {"value": "EFO:0030072", "name": "high-level gain"}
        ]
      }
    ]
  }
]
DEV: Changes
aggregationTerms in requests
- improved the description which contained errors from the previous "list of lists" structure and did some confusing double-definitions of the same concepts
- changed the name of
categoriesfor specifying the returns of defined inaggregationTermstocategories - refactored
categoriesto a cleaner structure, so far with 3 different typesValueSelectorsRangeSelectorsSplitSelectors
- this allows 2 ways tio define value bins:
- ranges which might not cover the whole value space
- splits for, well, splitting the value space into bins of arbitrary sizes
beaconAggregationResults in responses/sections/
- removed
categories(andsplits) from the response definition since they don't serve a purpose besides a checkback of which categories were applied - TODO: clear directive that zero values have to be returned for categories
beaconAggregationTermsResults in responses/sections/
- reference the definitions for the categories in
aggregationTermsinrequestsinstead of separate definition - removed the full examples since they are provided in a separate examples document
endpoints
- corrected to
beaconAggregationTermsResponse - adding the
beaconAggregationResponseas an option to all endpoints files already containing abeaconCountResponsereference
Example Documents
aggregationTerms-example
- new document with aggregators aggr1-4
- includes demonstration of
categoriesfor values and ranges
beaconRequestBody-MAX-example
- added
aggr3as example of how to use theaggregatorsparameter in the request
beaconAggregationTermsResponse-example
- fixed the example document which was just an unedited copy of filteringTerms
beaconAggregationResults-examples
- aligned the examples with the aggr1-4 examples in the
aggregationTerms-exampledocument